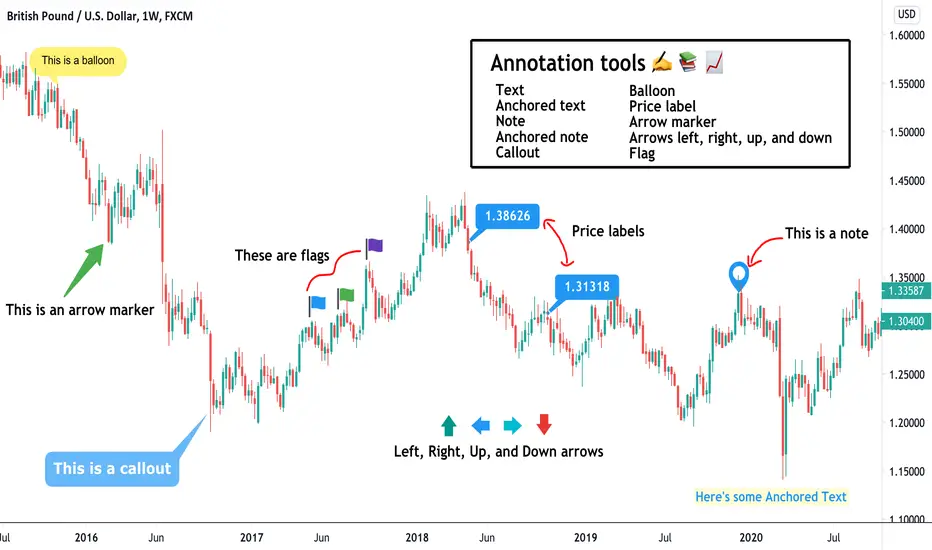
The Info Line tool (often the “Text” or “Note” annotation in TradingView) allows you to draw a line (horizontal, vertical, or angled) anchored to the chart and attach a customizable text box for detailed explanations. It’s excellent for clearly labeling historical events, price levels, or analysis notes without overwhelming the chart.
How to Use It Effectively on BTC Charts
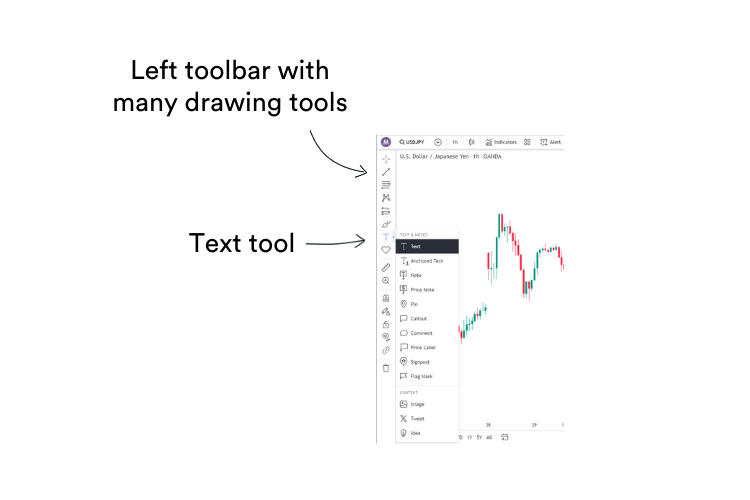
- Select the Text tool from the annotation toolbar (it looks like a “T” or note icon).
- Click on the chart to place the anchor point (e.g., at a specific date or price).
- Draw the line if needed, then double-click the attached text box to edit—add notes like event descriptions, impacts, or trade rationale.
- Pro tips: Use vertical lines for dates/events, horizontal for price levels. Customize font, color, and background for visibility. Combine with arrows or callouts for emphasis.
Example in Practice
For the 2024 Bitcoin halving (April 19–20, 2024, block 840,000), place a vertical info line on that date and label: “2024 Halving Event – Supply issuance reduced from 6.25 to 3.125 BTC/block. Historically followed by bull runs (e.g., +300% average in prior cycles).”
Current Bitcoin Application as of December 15, 2025
Bitcoin is trading around $88,500–$89,500, showing mild consolidation after recovering from recent lows near $80,000–$85,000. It remains ~30% below its October 2025 all-time high of ~$126,000, with sentiment cautious amid year-end positioning and macro uncertainty.
Info Line Scenarios:
- Vertical at October 2025: “ATH ~$126,000 – Peak euphoria; triggered multi-month correction.”
- Horizontal at $100,000: “Psychological Round Number – Major resistance; break could signal bull resumption.”
- At current range: Label support near $86,000–$88,000 as “December 2025 Higher Low – Potential accumulation zone.”
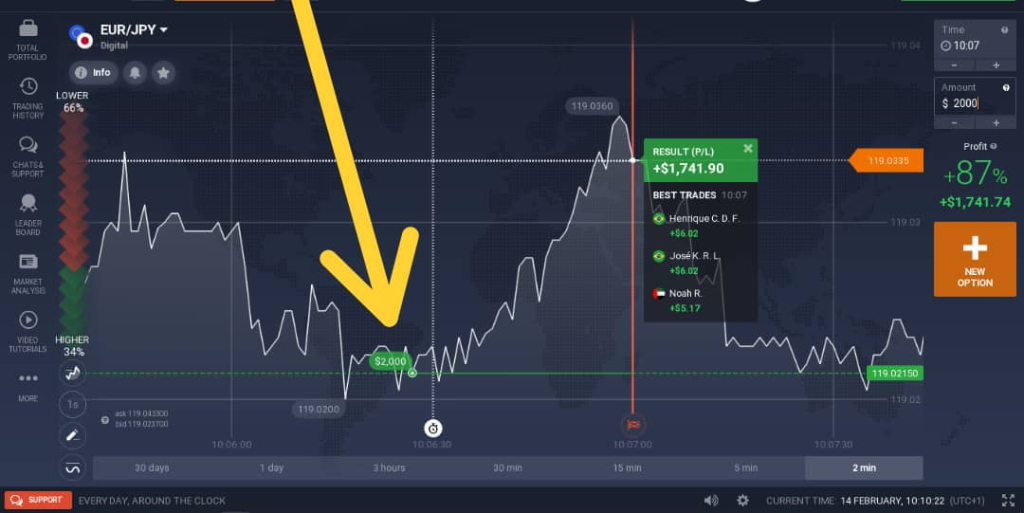
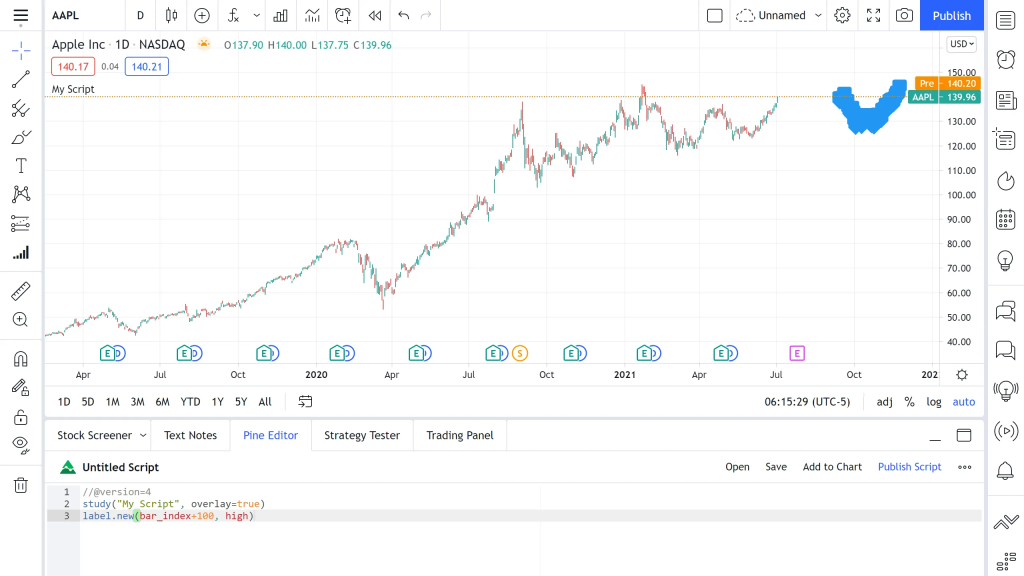
Here are examples of the Info Line/Text tool on charts, plus annotated BTC setups highlighting key events like halvings and current levels:
Info lines enhance chart readability for personal analysis or sharing ideas. Key watch: Hold above $88,000 for upside to $94,000+; break below risks retesting $80,000. Pair with volume/RSI for confirmation.